
 on the panel bar (often in the lower left corner
of the screen). This opens a menu list, click on the System Tools entry to open yet another pull
down menu. Here you choose the Terminal
program,
on the panel bar (often in the lower left corner
of the screen). This opens a menu list, click on the System Tools entry to open yet another pull
down menu. Here you choose the Terminal
program,  . In some cases there is already a Terminal program shown on the panel bar -- if
not then you can include it yourself. If this is the case, you can just click on
this one instead. The window that opens is a command tool window that responds
to typed commands. Move the courser into the window to highlight the outer
frame. This shows the window is ready to take your instructions. In many default
GUI settings, it is required to make a left mouse click inside the frame to
activate the window. When/if you need another commend tool, just repeat the same
procedure again.
. In some cases there is already a Terminal program shown on the panel bar -- if
not then you can include it yourself. If this is the case, you can just click on
this one instead. The window that opens is a command tool window that responds
to typed commands. Move the courser into the window to highlight the outer
frame. This shows the window is ready to take your instructions. In many default
GUI settings, it is required to make a left mouse click inside the frame to
activate the window. When/if you need another commend tool, just repeat the same
procedure again.| Lets start exploring the Linux file system. Tradition is to visualised it as an inverse tree structure with the (/root) at the top of the tree. Spreading from this are a number of tree trunks - directories - containing files and sub directories. An example of this is shown in the image to the right. |
|
|
|
Using ls with the appropriate
options you can make a long list that tells you more about the individual files
and directories. Try for instance ls -l.
This gives you a long listing with additional information of the individual
entries -- use the man page to find out what the information tells you!
|
|
|
|
|
|
|
|
|
|
There are three different definitions of a Megabyte. To clearfy the
differences take a look at this webpage.
To see how much disk space you are using use the
command quota.
$ quota
quota shows both your present disk usage and
how much disk space you are allowed to use. Are you close to your limit? I guess
not! There are two important limits. The first is named quota and the
other limit. The first one tells how much disk space you are allowed to
use without being told by the system. When you pass this limit, you will be told
- either next time you login or next time you open a new command tool. You are
then given a finite time to remove enough data to bring you below this limit.
The limit is a more severe limit. If you reach this one, you can't
continue working before you have removed enough data to bring you below the
quota limit. One effect of this is that you can't login to the machine
using a graphical terminal as this process writes information to your home
directory. As a student you are not given a very high quota, so as we proceed
with the course, you may find that you have to clean out data that can easily be
reproduced.
Assume you are close to you quota limit, and you need
to clean up by deleting files. If you have a large directory tree, the previous
commands don't tell you where you use most disk space. This may be achieved
using the du command. Using specific
options with du it possible to get
information about the distribution of disk usage in your files/directories below
the pwd.
$ du ?? *
|
|
|
|
|
|
A different way to see the running processes is by using the top command:
$ top
This gives a listing of processes,
with the most CPU demanding at the top. This list is per default updated every 5
seconds.
|
|
To get out of top you have to type q inside the window.
|
|
|
|
Just to read the content of a file without opening it in an editor you should
try more file and possible also the related tail....
The
program wc counts the number of lines
and words in its input. To count the lines of file above you could do
$
cat file | wc
The symbol | implies that the output
from the first command is used as input for the following
command.
Additional we may use >>, which implies that the content
of file is added at the end of the existing file, tmp
$
cat file >> tmp
Similarly
< can be used to redirect input into a program, for instance as shown
here,
$ wc < file >
tmp
This line counts the number of lines and words in file and puts the result into tmp.
|
|
A file contains 3 columns: col1, col2, col3. For all lines in the file
you want to plot col1 as the x-coordinate and (col2+5*col3**2)*cos(col1) as the
y-coordinate.
|
|
A black body emits radiation with a wavelength dependent intensity given
by Planck's law: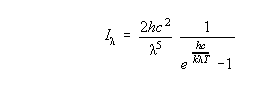
where
k= 1.3806e-23 ; Boltzmann's constant J/K
h= 6.6262e-34 ; Planck's constant
J s
c= 2.99792e8 ; Speed of light m/s.
or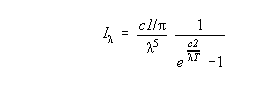
where
c1= 3.741e34 W 2
c2= 1.439e8 m K, when the wavelength is
measured in Ångstrøm (10-10 m).
Plot the function with different values of T in the interval 3000 to
15000
add Title, Labels, grid.... and replot
|
|
|
|
Add title, labels etc. to the graph. When it finished, then use an editor
to make a script containing all definitions and settings and run the script in
gnuplot by typing:
>load
"filename"
where "filename" represents the name of the script.
Remember to use reset to remove
previous definitions and settings.
For writing reports or posting images
on the web, you will need to save the plots from gnuplot in an appropriate
formate. This will be in postscript format for LaTeX file and png for the web.
This may be done by doing
set terminal postscript
eps
set output "fig1.eps"
replot
set terminal
x11
or
set terminal
png #
See this link for options to png
set output
"Planck.png"
replot
set terminal x11
You will be
able to view the eps file using kghostview by typing:
$ kghostview fig1.eps
&
and the png file using:
$ gimp Planck.png
or simply load it into
the web browser using the Open file menu
under File in the top bar.
To make this and coming image
visible for the checks, you have to make a soft link between your
public_html directory and the Dat_F directory. To do this you use
the following commands:
$ cd
~/public_html
$ ln -s ../Dat_F Dat_F
If you don't
have a public_html in your home directory, you have to make this
directory first before making the soft link (mkdir public_html). Check that it
works by opening this corrected address in your
browser:
http://www.fys.ku.dk/~"usrid"/Dat_F/Exercise_1/Planck.png
|
|
           <x0> <y0> <z0,0>
           <x0> <y1> <z0,1>
           <x0> <y2> <z0,2>
            :    :     :
           <x0> <yM> <z0,M>
<x1> <y0> <z1,0>where N, and M are the two dimensions of the data set.
<x1> <y1> <z1,1>
: : :
<x1> <M> <z1,M>
: : :
<xN> <yM> <zN,M>
Notice that the <N+1> has to have floating point format and not integer as one would have assumed.....
            <N+1>  <y0>   <y1>   <y2>  ...  <yN>
            <x0> <z0,0> <z0,1> <z0,2> ... <z0,N>
            <x1> <z1,0> <z1,1> <z1,2> ... <z1,N>
             :      :      :      :   ...    :
|
|